Dashboards
Charts over the data your connections have synced, at /dashboards.
What it’s for
Section titled “What it’s for”Dashboards show the numbers behind your customers’ platforms without anyone writing a query: revenue, receivables aging, order volume, pipeline, ticket backlog, shipment exceptions and more.
- Every chart is computed only over the tenants you can see.
- No chart reads personal data.
Who can use it
Section titled “Who can use it”dashboards:view(viewer, operator, admin) opens dashboards.dashboards:edit(operator, admin) creates, edits and deletes custom dashboards. You can edit only your own; admins can edit any.dashboards:share_all(admin) shares a dashboard with everyone and decides who sees each embedded Superset dashboard.- The Adapter and Connection filters on a single-vertical dashboard
also need
connections:read.
What you can do
Section titled “What you can do”-
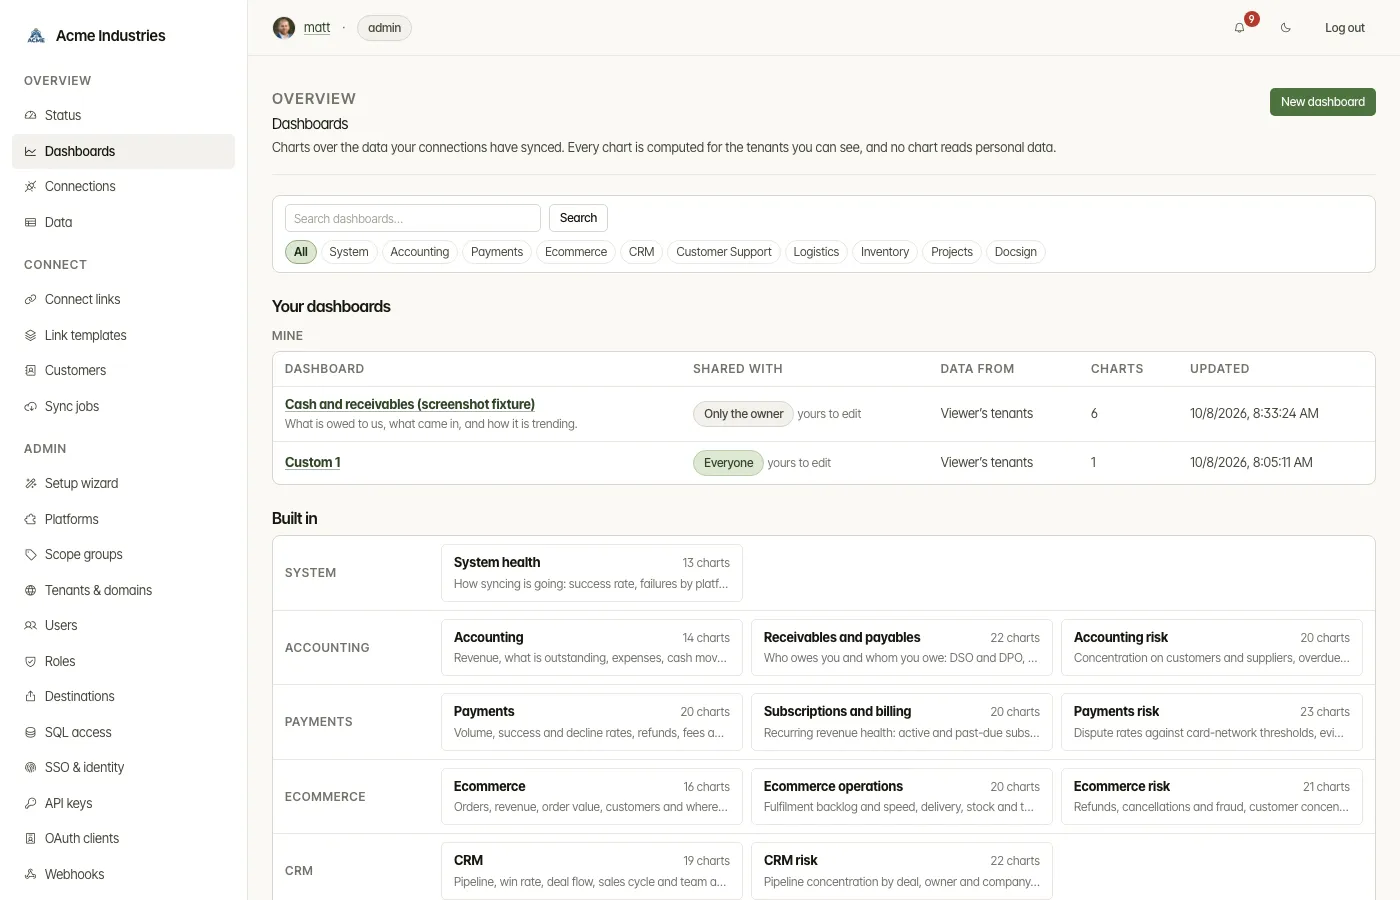
Open a built-in dashboard. OpenSteward ships 22, grouped by vertical:
- System health;
- an overview and a risk dashboard for each of the nine verticals;
- Receivables and payables (accounting), Subscriptions and billing (payments) and Ecommerce operations.
Built-ins are read-only.
-
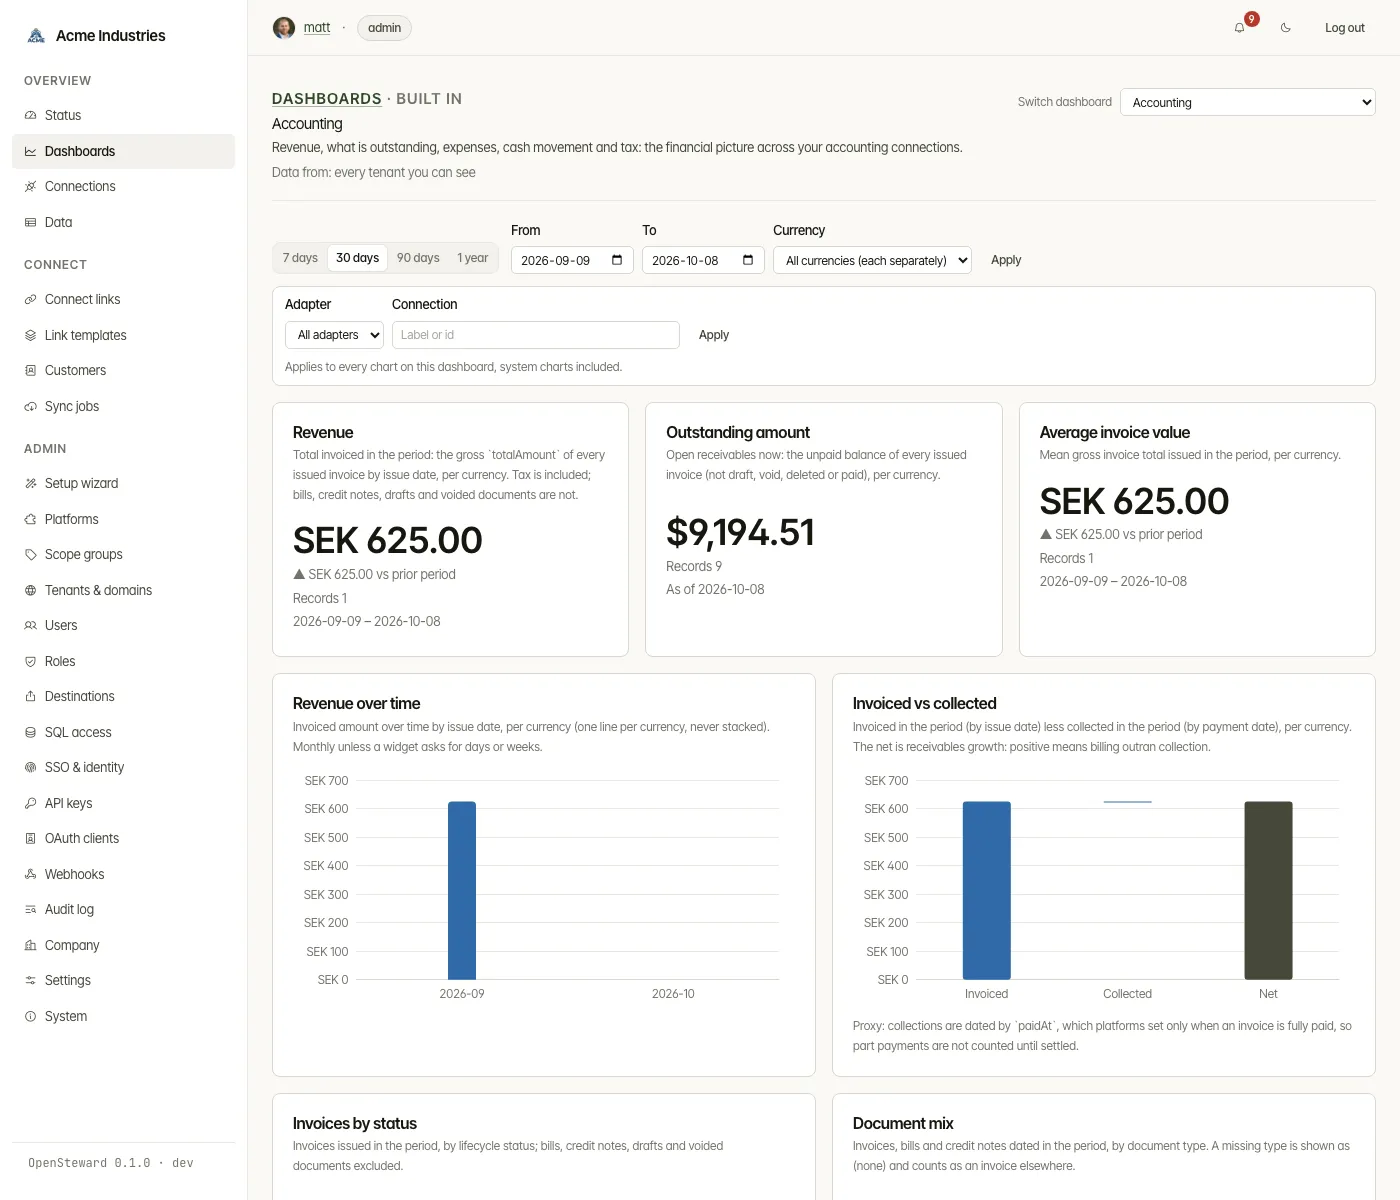
Filter what a dashboard shows.
- Date range. Pick 7 days, 30 days, 90 days or 1 year, or set custom From and To dates.
- Currency. Show all currencies or one. Money is never added up across currencies: with no currency chosen, each money chart draws every currency separately.
- Adapter and connection. On a single-vertical dashboard you can narrow every chart to one adapter, or to one connection. Search for the connection by label or by part of its id.
-
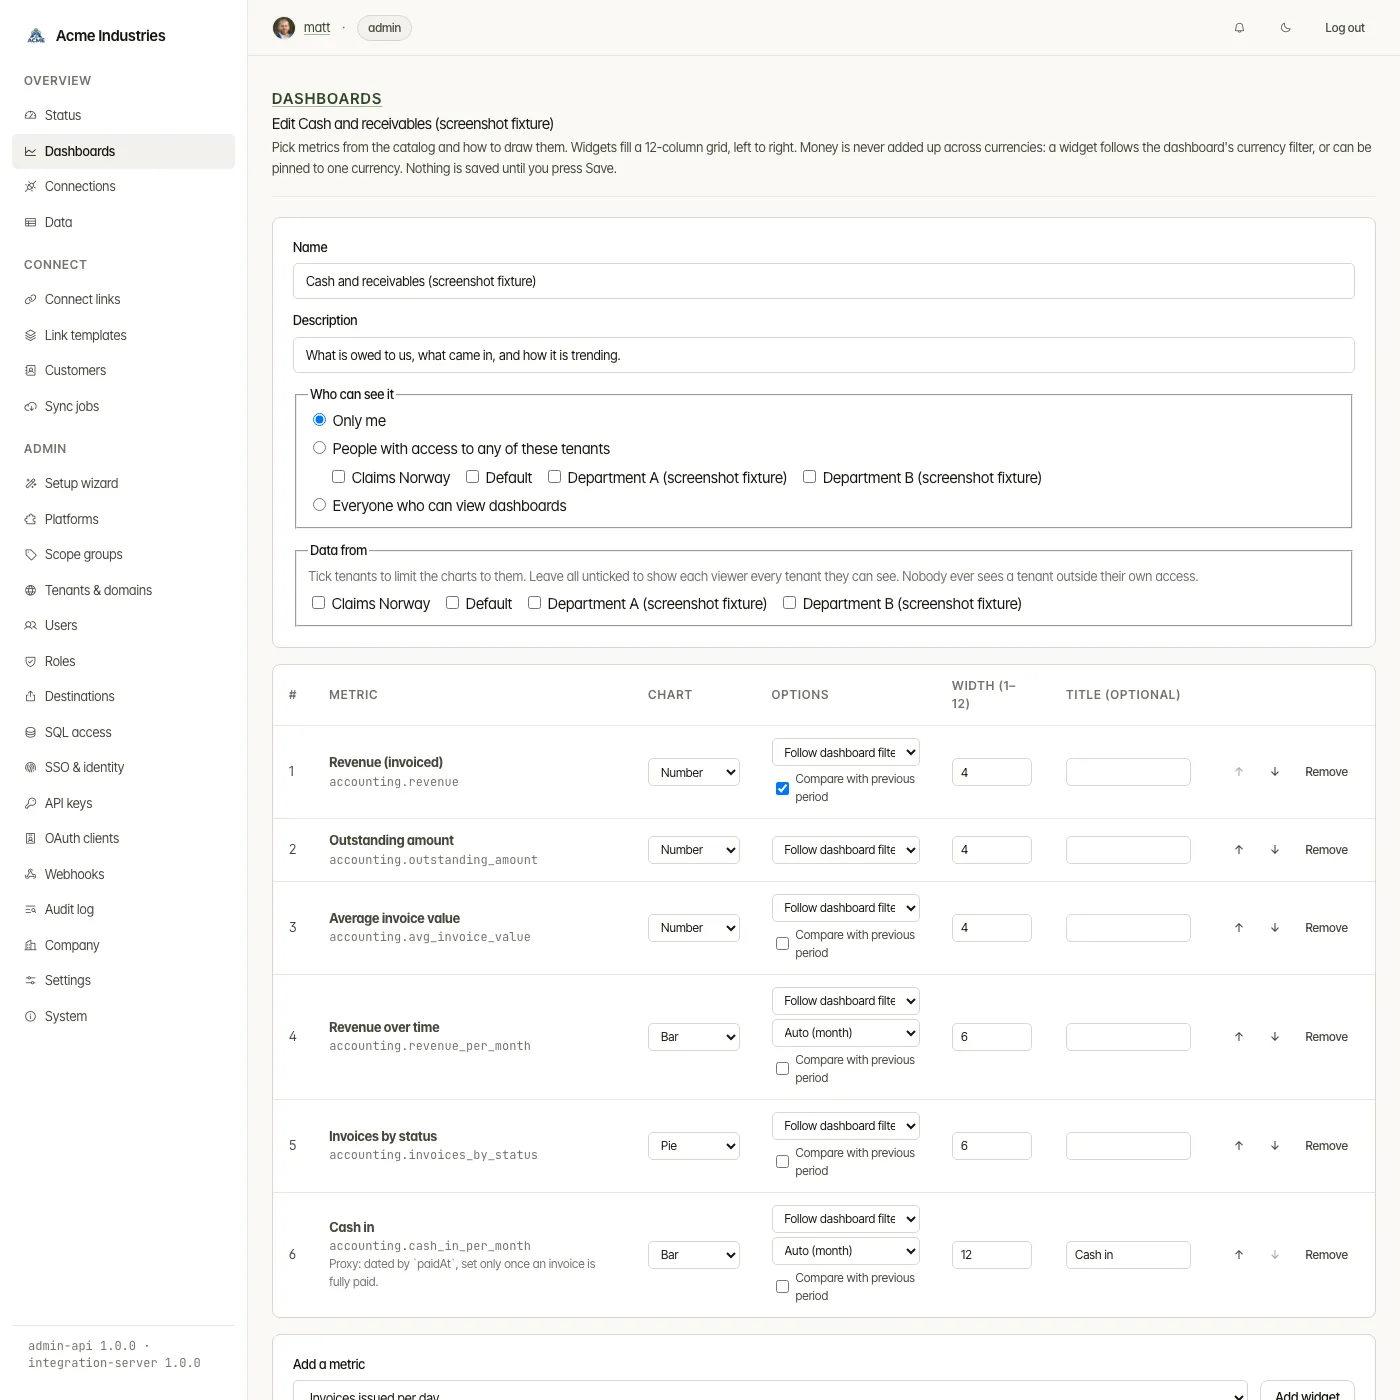
Build your own with New dashboard. There’s no code involved.
-
Give it a name and a description.
-
Choose who can see it:
- only you;
- people with access to any of the tenants you tick;
- everyone who can view dashboards (needs
dashboards:share_all).
-
Optionally use Data from to limit the charts to some tenants. If you tick none, each viewer sees every tenant they can access. Nobody ever sees a tenant outside their own access.
-
Add up to 24 widgets from the metric catalog. For each widget you pick:
- a chart type, from 22 kinds (number, gauge, line, bar, pie, funnel, heatmap, calendar and more), limited to the ones that suit the metric;
- a width from 1 to 12, on a 12-column grid;
- an optional title.
Some metrics offer more:
- a currency pin;
- time buckets (auto, day, week, month);
- Compare with previous period.
Move widgets with ↑ and ↓. Nothing is saved until you press Save.
-
-
Find a dashboard.
- The index lists Your dashboards first: Mine, Shared with your tenants and Shared with everyone. Admins who can see every tenant also see Other users’ private dashboards.
- Built in follows, one row per vertical with its dashboards side by side. Each shows its chart count and the first line of its description; hover for the rest.
- Search matches names and descriptions. A vertical chip narrows the list to one vertical. Your own dashboards appear under a chip when any of their charts comes from that vertical. The URL keeps the filter, so you can bookmark or share it.
-
Switch dashboards from any dashboard with the Switch dashboard menu at the top right. It lists every dashboard you can open, grouped the same way, so you don’t need to go back to the index.
-
Open embedded Superset dashboards. These appear only when the deployment runs Superset. They are listed under Custom dashboards (Superset) and filtered to your tenants.
Related docs
Section titled “Related docs”- Architecture: data access: the metric catalog, currencies, scope and caching.
- Superset setup: optional embedded Superset, Postgres only.
- Permissions, roles and tenant scope.
opensteward.dev ·Plans and free license ·Terms ·Privacy ·support@opensteward.dev
© 2026 Falco Consulting AB. Built from open-steward/opensteward@a3961d8. This site sets no cookies, runs no analytics and loads nothing from other sites, except platform logos from Brandfetch on the Platforms page.